Saratoga September 2026 Market Report
The period at a glance
| Metric | September 2026 | September 2025 |
|---|---|---|
| Closings | 29 | 21 |
| Total volume | $126,110,430 | — |
| Median sale price | $3,680,000 | $4,100,000 |
| Median price per sq ft | $1,609 | $1,505 |
| Median sq ft sold | 2,642 | — |
| Active listings (end of period) | 69 | — |
| Pending listings (end of period) | 11 | — |
| Median active list price | $4,299,888 | — |
| Price range | $1,053,000–$17,250,000 | — |
September brought 29 closings—the strongest monthly count in the six-month window tracked here, and 38 percent more transactions than the same month a year ago. Total volume of $126.1 million was anchored at the top by a $17.25 million estate on Rolling Hills Road, yet the month's most instructive number sits at the other end of the size spectrum: a 788-square-foot bungalow on Elva Avenue closed at $3,312 per square foot, the highest per-foot figure in the roster and a reminder that lot value in Saratoga can compress any headline about livable area into something close to irrelevant.
The overall median sale price of $3.68 million is nominally lower than the $4.1 million recorded in September 2025, but the composition shift matters: this September included three condominiums and two townhouses, segments that were either absent or sparse a year ago, and those lower-priced closings pull the blended median down. The single-family median landed at exactly $4.1 million across 24 sales—flat year-over-year in price, up roughly 7 percent in price per square foot. Days-on-market figures are available for only one of the 29 closings (196 days, a townhouse at Maple Place), so no meaningful speed analysis is possible for this period; the source does not carry DOM for the remaining 28 transactions.
The sales
List prices were not recorded for four of the 29 closings; those transactions show no pct-of-list figure. The table below covers all 29 closings.
| Address | Segment | Beds | Sq Ft | Sale Price | $/Sq Ft | % of List | Closed |
|---|---|---|---|---|---|---|---|
| 22525 Rolling Hills Road | Single Family | 8 | 10,024 | $17,250,000 | $1,721 | 90.8% | Sep 15 |
| 18880 Bella Vina | Single Family | 5 | 5,213 | $8,500,000 | $1,631 | 92.4% | Sep 14 |
| 13385 Surrey Lane | Single Family | 4 | 3,953 | $7,000,000 | $1,771 | 107.7% | Sep 4 |
| 15164 Montalvo Road | Single Family | 5 | 3,198 | $5,850,000 | $1,829 | — | Sep 8 |
| 13958 Chester Avenue | Single Family | 5 | 4,787 | $5,750,000 | $1,201 | 96.6% | Sep 25 |
| 20210 La Paloma Avenue | Single Family | 5 | 3,419 | $5,500,000 | $1,609 | 95.7% | Sep 8 |
| 19201 Harleigh Drive | Single Family | 5 | 2,742 | $5,101,000 | $1,860 | 107.4% | Sep 10 |
| 20319 Kirkmont Drive | Single Family | 4 | 2,772 | $4,900,000 | $1,768 | 106.5% | Sep 21 |
| 15355 Peach Hill Road | Single Family | 5 | 3,266 | $4,300,000 | $1,317 | 96.6% | Sep 18 |
| 13428 Christie Drive | Single Family | 5 | 2,642 | $4,300,000 | $1,628 | 100.0% | Sep 3 |
| 18645 Allendale Avenue | Single Family | 4 | 4,203 | $4,200,000 | $999 | 95.5% | Sep 4 |
| 13698 Manteca Way | Single Family | 5 | 2,916 | $4,150,000 | $1,423 | 96.6% | Sep 23 |
| 18661 Woodbank Way | Single Family | 4 | 3,783 | $4,050,000 | $1,071 | 106.6% | Sep 24 |
| 18627 Ambleside Lane | Single Family | 4 | 2,188 | $3,880,000 | $1,773 | — | Sep 9 |
| 20615 Leonard Road | Single Family | 5 | 2,142 | $3,680,000 | $1,718 | 99.5% | Sep 21 |
| 21030 Canyon View Drive | Single Family | 3 | 2,516 | $3,650,000 | $1,451 | 97.3% | Sep 24 |
| 13945 Vista Regina | Single Family | 4 | 3,035 | $3,600,000 | $1,186 | 94.7% | Sep 25 |
| 14271 Springer Avenue | Single Family | 3 | 2,109 | $3,500,000 | $1,660 | 103.6% | Sep 8 |
| 12425 Woodside Drive | Single Family | 4 | 2,295 | $3,500,000 | $1,525 | 93.3% | Sep 13 |
| 20154 Knollwood Drive | Single Family | 3 | 2,006 | $3,400,000 | $1,695 | 100.1% | Sep 16 |
| 18564 Paseo Tierra | Single Family | 3 | 1,946 | $2,950,000 | $1,516 | 102.1% | Sep 23 |
| 18297 Clemson Avenue | Single Family | 4 | 1,748 | $2,850,000 | $1,630 | 98.3% | Sep 11 |
| 18397 Swarthmore Drive | Single Family | 3 | 1,400 | $2,800,000 | $2,000 | 100.0% | Sep 2 |
| 11210 Cottonwood Place #35-08 | Townhouse | 4 | 2,682 | $2,692,051 | $1,004 | 93.8% | Sep 28 |
| 14351 Elva Avenue | Single Family | 2 | 788 | $2,610,000 | $3,312 | 114.5% | Sep 24 |
| 11040 Maple Place #28-06 | Townhouse | 3 | 1,741 | $1,869,379 | $1,074 | — | Sep 28 |
| 14672 Wild Berry Lane | Condominium | 3 | 2,163 | $1,800,000 | $832 | — | Sep 4 |
| 19554 Vineyard Lane | Condominium | 2 | 1,392 | $1,425,000 | $1,024 | 107.5% | Sep 24 |
| 14666 Big Basin Way #3 | Condominium | 2 | 1,276 | $1,053,000 | $825 | 100.3% | Sep 30 |
Four transactions deserve particular attention. The Rolling Hills Road estate—10,024 square feet on 2.7 acres, built 2013, listed at $18,998,000—closed at $17,250,000, a 9.2 percent discount from list that still produced the month's highest absolute price and its second-highest per-foot rate at $1,721. The seller accepted a figure that would have been September's only sub-$1,800 per-foot result at this size tier, but the sheer footprint makes the discount arithmetically necessary to read carefully: nine points on a $19 million ask is $1.75 million, not a rounding error.
At the other end of the size spectrum, 14351 Elva Avenue—a two-bedroom, 788-square-foot house built in 1954 on a 7,500-square-foot lot—closed at $2,610,000 against a $2,280,000 list, 14.5 percent above asking and the largest premium of the month. The per-foot figure of $3,312 has no close rival in the roster. The house is small; the lot, in Saratoga's school-district context, is not nothing. The closing record verifies the price; it says nothing about why.
Two homes on Harleigh Drive and Surrey Lane both cleared their list prices by more than 7 percent—$5,101,000 against a $4,750,000 ask and $7,000,000 against $6,500,000, respectively. Both were 1960s-era single-family homes, updated to varying degrees, on lots above 20,000 square feet. Surrey Lane's 1956 build produced the month's highest per-foot figure among homes above 3,000 square feet at $1,771.
Where the market split
By segment
| Segment | Sales | Median Price | Median $/Sq Ft | Median Sq Ft | Price Range | Over List |
|---|---|---|---|---|---|---|
| Single Family | 24 | $4,100,000 | $1,630 | 2,757 | $2,610,000–$17,250,000 | 10 of 24 |
| Condominium | 3 | $1,425,000 | $832 | 1,392 | $1,053,000–$1,800,000 | 2 of 3 |
| Townhouse | 2 | — | — | — | $1,869,379–$2,692,051 | 0 of 2 |
The townhouse segment recorded only two sales—both new construction at the Cottonwood Place and Maple Place addresses—so no median is presented; the range was $1,869,379 to $2,692,051, and both closed below or without a list price. The condominium segment had three sales with a median of $1,425,000 and a median per-foot rate of $832—roughly half the single-family per-foot figure, reflecting both smaller footprints and attached-unit pricing norms. Two of the three condos closed above list.
The single-family segment carried the month: 24 closings, $4.1 million median, $1,630 median per square foot, and 10 of 24 transactions clearing the asking price. The gap between the $4.1 million single-family median and the $1,425,000 condo median is not a market anomaly—it reflects Saratoga's structural composition, where detached homes on meaningful lots have historically priced at a substantial premium to attached product.
By price band
| Band | Sales | Median Price | Median $/Sq Ft |
|---|---|---|---|
| $1M–$1.5M | 2 | $1,239,000 | $924 |
| $1.5M–$2M | 2 | $1,834,690 | $953 |
| $2M–$3M | 5 | $2,800,000 | $1,630 |
| $3M–$5M | 13 | $3,880,000 | $1,525 |
| $5M and up | 7 | $5,850,000 | $1,721 |
The $3M–$5M band absorbed the most activity: 13 of 29 closings, nearly half the month's transactions, with a median of $3,880,000 and $1,525 per square foot. The $5M-and-up tier—seven sales—carried a median per-foot rate of $1,721, the highest of any band, suggesting that larger and more expensive homes in September were not trading at a per-foot discount relative to mid-market. The two price bands below $2M recorded only two sales each, making the medians there (both based on two transactions) descriptive rather than indicative of a pattern.
The $2M–$3M band is where the Elva Avenue outlier sits: at $3,312 per foot, it pulls the band's median per-foot to $1,630, the same figure as the single-family segment median—an artifact of the small sample (five sales) rather than a coincidence of pricing logic.
Across the period
| Month | Closings | Median Price | Median $/Sq Ft |
|---|---|---|---|
| Apr 2026 | 10 | $2,488,000 | $1,168 |
| May 2026 | 11 | $3,020,000 | $1,309 |
| Jun 2026 | 8 | $4,297,000 | $1,496 |
| Jul 2026 | 6 | $4,140,000 | $1,620 |
| Aug 2026 | 26 | $4,075,000 | $1,460 |
| Sep 2026 | 29 | $3,680,000 | $1,609 |
The six-month arc tells two different stories depending on which column you read. The median sale price rose from $2,488,000 in April to a peak near $4,297,000 in June, retreated slightly through July and August, and sat at $3,680,000 in September. The per-foot measure moved more consistently upward: $1,168 in April, $1,609 in September, with only August's $1,460 breaking the general direction of travel. The divergence between a declining median price and a rising median per-foot rate in August and September points to a mix shift toward smaller homes trading at high per-foot rates—the Elva Avenue sale in September being the most visible example.
Transaction volume by count expanded sharply in the back half: April through July averaged fewer than nine closings per month; August and September produced 26 and 29, respectively. Whether that pace persists, slows, or reverses is not something the closing record can answer.
What it means
For sellers. Twenty-five of the 29 closings with a known list price resolved within 7.7 percent of asking in either direction; the median came in at 99.5 percent of list across the 25 transactions where that figure is calculable. Twelve sales closed above list, 13 below, and one at exactly list. The spread between the largest premium (14.5 percent above) and the largest discount (9.2 percent below) was 23.7 points—a wide range that suggests list price positioning had meaningful consequences for final outcomes. Homes priced in the $3M–$5M range found the most buyers in September: 13 of 29 closings landed there. The 69 active listings at month's end, with a median active list price of $4,299,888, represent the inventory context into which any new listing enters.
For buyers. Thirteen of the 25 transactions with known list prices closed below asking, with discounts ranging from a fraction of a point to 9.2 percent. At the same time, twelve closed above asking, with premiums as high as 14.5 percent. The month did not resolve uniformly in either direction; outcomes varied by property, not by any single market-wide condition. The $1M–$2M price range saw only four closings in September; inventory in that band at month's end, or the absence of it, is not captured in the transaction record.
For owners not transacting. The median price per square foot for single-family homes in September 2026 was $1,630 across 24 closings, compared with a blended market median of $1,505 per square foot in September 2025 across 21 closings. That is a 7 percent year-over-year movement in the per-foot figure; the median sale price across all segments was nominally lower this September ($3,680,000 versus $4,100,000), attributable in part to the inclusion of condominium and townhouse product not present in similar proportion a year ago. The single-family median, at $4,100,000, was flat year-over-year.
Tim McMullen · CA DRE #02016832
[email protected] · (415) 691-9272
Press kit: figures & citation for this report →
More Saratoga market reports
Saratoga Q3 2026 Market Report
Saratoga Posts $253M in Q3 2026, Median Price $3.85M Across 61 Closings
Saratoga 2025 Market Report
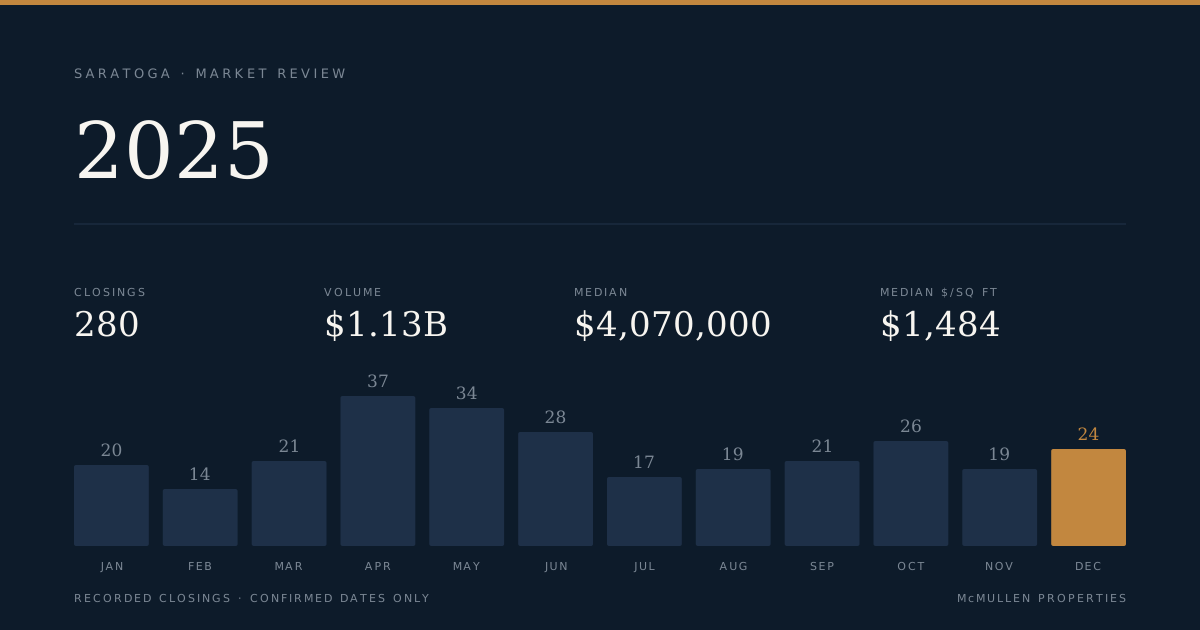
Saratoga's 280 Closings in 2025 Totaled $1.13 Billion, With a $20M Ranch Setting the Ceiling
Saratoga Q1 2026 Market Report
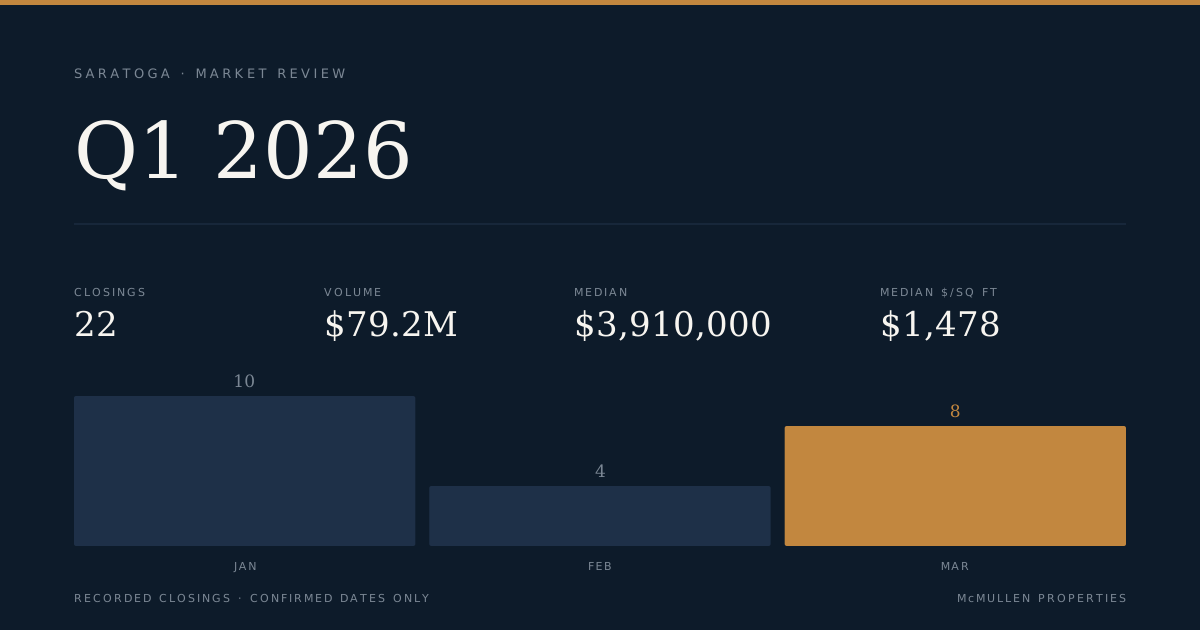
Saratoga Q1 2026: 22 Closings, $79.2M in Volume, and a $2,707/SF Outlier That Rewrote the Range