Saratoga Q3 2026 Market Report
The quarter at a glance
| Metric | Value |
|---|---|
| Period | Q3 2026 (Jul – Sep) |
| Total closings | 61 |
| Total volume | $253,298,684 |
| Median sale price | $3,850,000 |
| Median price per sq ft | $1,532 |
| Median lot size | 12,508 sq ft |
| Median home size | 2,642 sq ft |
| Price range | $798,000 – $17,250,000 |
| List-price comparison | Not available for this period |
| Days on market | Recorded for 12 of 61 closings — see note below |
Sixty-one transactions closed in Saratoga between July 1 and September 30, 2026, generating $253.3 million in total volume. The median sale price landed at $3,850,000 — a figure pulled up by the quarter's dominant segment: 53 single-family closings with a median of $4,200,000 and a per-square-foot median of $1,609. List-price data is not available for this period, so no over-asking analysis is possible. Days on market are recorded for only 12 of the 61 closings — well under half — so those figures describe a narrow slice of the quarter rather than the whole.
The most notable internal tension in the quarter is the price-per-square-foot spread within the single-family segment itself. At the low end of the roster, 15940 Wildcat Ridge — a 4,953-square-foot home on 7.3 acres — closed at $767 per square foot, the lowest rate of any single-family sale in the top 40. At the high end, 19700 Minocqua Court, a 3,442-square-foot home on Saratoga's west side, closed at $1,947 per square foot. Same segment, same quarter: a gap of $1,180 per square foot. Size did not determine rate. Lot size did not determine rate in any simple direction. The properties that cleared $1,700 per square foot ranged from 2,142 square feet to 10,024 square feet.
The sales
The table below shows the top 40 closings by price. The full quarter recorded 61 closings.
| Address | Segment | Beds | Sq Ft | Lot Sq Ft | $/Sq Ft | Sale Price | Closed | DOM |
|---|---|---|---|---|---|---|---|---|
| 22525 Rolling Hills Road | SF | 8 | 10,024 | 116,741 | $1,721 | $17,250,000 | Sep 15 | — |
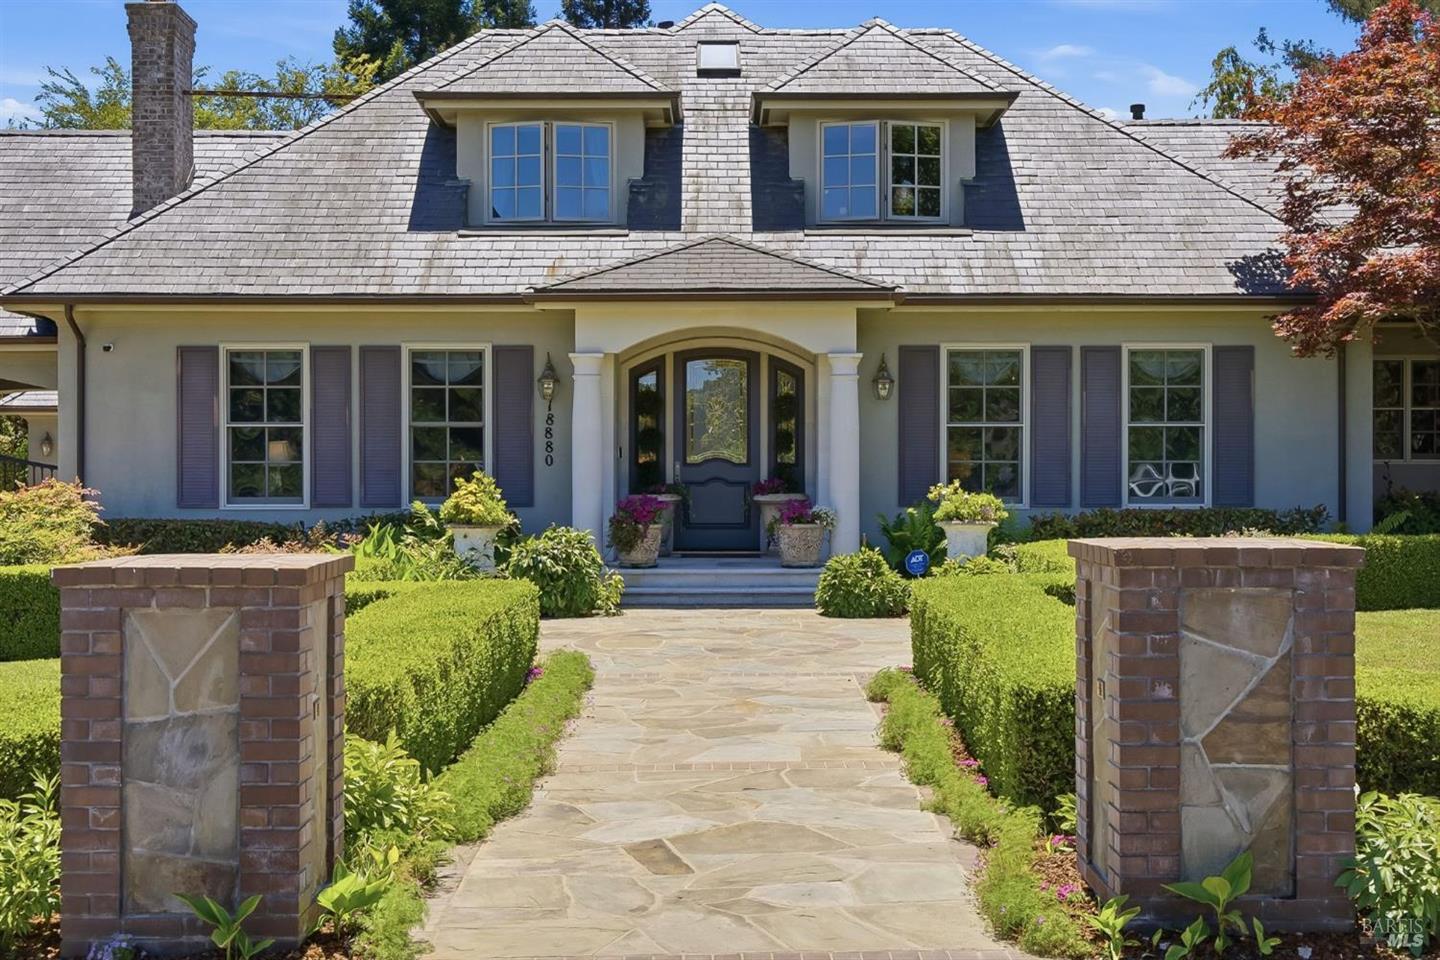
| 18880 Bella Vina | SF | 5 | 5,213 | 40,075 | $1,631 | $8,500,000 | Sep 14 | — |
| 14810 Farwell Avenue | SF | 4 | 4,529 | 43,560 | $1,755 | $7,950,000 | Aug 28 | — |
| 13385 Surrey Lane | SF | 4 | 3,953 | 46,174 | $1,771 | $7,000,000 | Sep 4 | — |
| 19700 Minocqua Court | SF | 4 | 3,442 | 37,400 | $1,947 | $6,700,000 | Aug 31 | — |
| 14634 Granite Way | SF | 4 | 3,371 | — | $1,869 | $6,300,000 | Aug 13 | 6 |
| 14695 Horseshoe Drive | SF | 5 | 4,294 | 11,660 | $1,432 | $6,150,000 | Aug 28 | — |
| 15164 Montalvo Road | SF | 5 | 3,198 | 40,800 | $1,829 | $5,850,000 | Sep 8 | — |
| 13958 Chester Avenue | SF | 5 | 4,787 | 43,560 | $1,201 | $5,750,000 | Sep 25 | — |
| 19348 Harleigh Drive | SF | 5 | 2,811 | — | $1,981 | $5,568,000 | Jul 20 | 7 |
| 20210 La Paloma Avenue | SF | 5 | 3,419 | 13,261 | $1,609 | $5,500,000 | Sep 8 | — |
| 14300 Maclay Court | SF | 5 | 3,300 | 39,073 | $1,632 | $5,385,000 | Aug 27 | — |
| 18709 McCoy Avenue | SF | 5 | 3,356 | 11,220 | $1,579 | $5,300,000 | Jul 24 | — |
| 19201 Harleigh Drive | SF | 5 | 2,742 | 20,020 | $1,860 | $5,101,000 | Sep 10 | — |
| 20319 Kirkmont Drive | SF | 4 | 2,772 | 11,576 | $1,768 | $4,900,000 | Sep 21 | — |
| 19241 Brockton Lane | SF | 5 | 2,664 | — | $1,839 | $4,900,000 | Aug 10 | 3 |
| 18797 Westview Drive | SF | 5 | 2,877 | — | $1,661 | $4,780,000 | Jul 27 | 5 |
| 19990 Blythe Court | SF | 4 | 2,699 | 15,600 | $1,745 | $4,709,250 | Aug 4 | — |
| 20555 Carniel Avenue | SF | 4 | 2,749 | — | $1,710 | $4,701,116 | Aug 12 | 5 |
| 20096 Chateau Drive | SF | 4 | 3,436 | 15,232 | $1,368 | $4,700,000 | Aug 25 | — |
| 13090 Heath Street | SF | 8 | 3,572 | — | $1,274 | $4,550,000 | Aug 3 | 109 |
| 14211 Juniper Lane | SF | 3 | 2,838 | 20,473 | $1,586 | $4,500,000 | Aug 8 | — |
| 19922 Scotland Drive | SF | 3 | 2,249 | 10,700 | $1,943 | $4,368,888 | Aug 18 | — |
| 15355 Peach Hill Road | SF | 5 | 3,266 | 43,996 | $1,317 | $4,300,000 | Sep 18 | — |
| 13428 Christie Drive | SF | 5 | 2,642 | 8,000 | $1,628 | $4,300,000 | Sep 3 | — |
| 13594 Old Oak Way | SF | 4 | 3,056 | 41,574 | $1,407 | $4,300,000 | Aug 25 | — |
| 18645 Allendale Avenue | SF | 4 | 4,203 | 12,282 | $999 | $4,200,000 | Sep 4 | — |
| 13698 Manteca Way | SF | 5 | 2,916 | 9,900 | $1,423 | $4,150,000 | Sep 23 | — |
| 18661 Woodbank Way | SF | 4 | 3,783 | 43,470 | $1,071 | $4,050,000 | Sep 24 | — |
| 18627 Ambleside Lane | SF | 4 | 2,188 | 46,174 | $1,773 | $3,880,000 | Sep 9 | — |
| 13561 Myren Drive | SF | 6 | 2,526 | 10,876 | $1,524 | $3,850,000 | Aug 25 | — |
| 13371 Quito Road | SF | 5 | 2,553 | 10,790 | $1,488 | $3,800,000 | Aug 15 | — |
| 15940 Wildcat Ridge | SF | 5 | 4,953 | 317,117 | $767 | $3,800,000 | Aug 31 | — |
| 20615 Leonard Road | SF | 5 | 2,142 | 16,220 | $1,718 | $3,680,000 | Sep 21 | — |
| 21030 Canyon View Drive | SF | 3 | 2,516 | 13,503 | $1,451 | $3,650,000 | Sep 24 | — |
| 13945 Vista Regina | SF | 4 | 3,035 | 54,886 | $1,186 | $3,600,000 | Sep 25 | — |
| 14271 Springer Avenue | SF | 3 | 2,109 | 7,500 | $1,660 | $3,500,000 | Sep 8 | — |
| 12425 Woodside Drive | SF | 4 | 2,295 | 12,349 | $1,525 | $3,500,000 | Sep 13 | — |
| 18941 Cyril Place | SF | 5 | 2,284 | — | $1,532 | $3,500,000 | Jul 27 | 71 |
| 20154 Knollwood Drive | SF | 3 | 2,006 | 12,508 | $1,695 | $3,400,000 | Sep 16 | — |
Four sales define the outer edges of the quarter. The top close, 22525 Rolling Hills Road, was a 10,024-square-foot, 8-bedroom home on a 2.7-acre lot that changed hands for $17,250,000 on September 15 — the only transaction in the quarter above $10 million and the one that does the most work lifting the segment average away from the median. At the other end of the roster visible here, 20154 Knollwood Drive — 2,006 square feet, built 1970, on a 12,508-square-foot lot — closed at $3,400,000 on September 16, or $1,695 per square foot, a rate that sits well above what several larger homes achieved.
Two sales that had DOM recorded are worth examining side by side. 13090 Heath Street, an 8-bedroom, 3,572-square-foot home, sat for 109 days before closing at $4,550,000, or $1,274 per square foot — the longest measured wait in the roster. 19241 Brockton Lane, a 5-bedroom, 2,664-square-foot home, closed in 3 days at $4,900,000, or $1,839 per square foot. Fewer square feet, faster resolution, higher rate. 18941 Cyril Place logged 71 days before closing at $3,500,000 — the second-longest measured DOM, and the only other property in the recorded subset that spent more than 60 days in market. Because DOM is available for only 12 of 61 closings, these figures describe those specific transactions and cannot be read as a quarter-wide speed profile.
One structural outlier: 15940 Wildcat Ridge, a 5-bedroom, 4,953-square-foot home on 317,117 square feet — just over 7 acres — of Saratoga hillside, closed at $3,800,000 or $767 per square foot. Every other single-family close in the top 40 cleared $999 per square foot. The price reflects the lot's character and likely the home's condition relative to the acreage, though the record does not state either.
Where the market split
By segment
| Segment | Closings | Median Price | Median $/Sq Ft | Median Sq Ft | Price Range |
|---|---|---|---|---|---|
| Single Family | 53 | $4,200,000 | $1,609 | 2,742 sq ft | $2,180,000 – $17,250,000 |
| Condominium | 6 | $1,001,500 | $829 | 1,334 sq ft | $798,000 – $1,800,000 |
| Townhouse | 2 | — | — | — | $1,869,379 – $2,692,051 |
The townhouse segment recorded two closings — below the three-sale minimum for a meaningful median. The two transactions ran from $1,869,379 to $2,692,051, with per-square-foot rates implied by a median of $1,039 across the pair; the range and the median are noted but should not be read as a trend from two data points.
Condominiums contributed 6 closings, enough for a median. At $1,001,500 and $829 per square foot, the condo segment operated in a separate market from the single-family base. Its price range — $798,000 to $1,800,000 — sits entirely below the single-family floor of $2,180,000. The six condo closings account for roughly 10 percent of the quarter's transaction count but a much smaller share of volume, given the price differential.
The single-family segment ran everything. Fifty-three closings, a $4,200,000 median, and a price range that spans from $2,180,000 to $17,250,000. The segment's $1,609 median per square foot sits above the all-segment quarter median of $1,532, reflecting both the price tier and the fact that condos and townhouses pull the blended figure down.
By price band
| Price Band | Closings | Median $/Sq Ft |
|---|---|---|
| Under $1M | 3 | $750 |
| $1M – $1.5M | 2 | $924 |
| $1.5M – $2M | 2 | $953 |
| $2M – $3M | 11 | $1,516 |
| $3M – $5M | 29 | $1,525 |
| $5M and up | 14 | $1,738 |
The $3M–$5M band did the bulk of the quarter's transactional work: 29 closings, nearly half the total, with a median rate of $1,525 per square foot. The $5M-and-up band added 14 more closings at a median of $1,738 — the highest rate of any band — confirming that the top tier maintained a consistent premium over the mid-market on a per-square-foot basis.
Below $2 million, the three price bands collectively account for 7 closings, all in the condo and townhouse segments. The $1M–$1.5M and $1.5M–$2M bands each had two closings, which is below the threshold for reliable medians; the figures are noted but carry limited weight. The under-$1M band had three closings at a median of $750 per square foot — the lowest rate in the quarter, consistent with smaller condo product.
The $2M–$3M band is worth a pause. Eleven closings, median rate $1,516 per square foot — nearly identical to the $3M–$5M band's $1,525. That convergence means moving from the $2M–$3M tier to the $3M–$5M tier did not, on the quarter's record, produce a meaningful per-square-foot step up. The step up came only at $5M and above.
Across the quarter
| Month | Closings | Median Price | Median $/Sq Ft |
|---|---|---|---|
| Jul 2026 | 6 | $4,140,000 | $1,620 |
| Aug 2026 | 26 | $4,075,000 | $1,460 |
| Sep 2026 | 29 | $3,680,000 | $1,609 |
July's six closings are a thin base — medians from that month describe those six transactions, not a market-wide July condition. August expanded sharply to 26 closings, the largest monthly count, with a median price of $4,075,000 and the quarter's lowest median per-square-foot rate of $1,460. September matched August's volume almost exactly with 29 closings, and the median per-square-foot rate recovered to $1,609 — back near the July reading — while the median price fell to $3,680,000.
The divergence between the price and rate trends in September is explained by composition: September's 29 closings included a heavier concentration of homes in the $3M–$4M range, which are smaller by square footage, producing a higher rate per foot even as the nominal price median declined. The $17,250,000 Rolling Hills Road close landed in September and did not lift that month's median, which speaks to how many closings were concentrated below $5M. August's lower rate partly reflects several large-square-footage homes — including the 4,953-square-foot Wildcat Ridge at $767 per foot and the 4,787-square-foot Chester Avenue home at $1,201 per foot — clearing in that month.
What it means
For sellers: The quarter's 53 single-family closings at a $4,200,000 median establish a reference point for the segment. Per-square-foot rates diverged widely — $767 to $1,947 within single-family alone — so size and price do not move in lockstep in this market. Larger homes did not consistently achieve higher rates; several of the quarter's highest rates per square foot belong to homes under 3,000 square feet. Homes that sat beyond 60 days (four in total among the subset with DOM recorded) closed at rates below the segment median, though the small DOM sample limits how far that observation generalizes.
For buyers: The $3M–$5M band absorbed 29 of the quarter's 61 closings — nearly half — with a median rate of $1,525 per square foot. Entry into the single-family segment began at $2,180,000. The condo segment offered six closings between $798,000 and $1,800,000 at a median of $829 per square foot, representing the only activity below the single-family floor. No list-price data is available for this period, so the relationship between asking and closing prices cannot be assessed from the record.
For owners not transacting: The quarter put $253.3 million through escrow across 61 closings — a volume figure that reflects a functioning market across all price tiers, with the $5M-and-up band contributing 14 closings at the highest per-square-foot median in the quarter. The rate spread across individual sales remains wide, and the month-by-month figures show that the mix of what closed in any given month shaped the medians as much as any directional price movement.
Tim McMullen · CA DRE #02016832
[email protected] · (415) 691-9272
Press kit: figures & citation for this report →
More Saratoga market reports
Saratoga September 2026 Market Report
Saratoga's September: 29 Closings, $126M in Volume, and a 1,400-Square-Foot House That Fetched $3,312 Per Square Foot
Saratoga 2025 Market Report
Saratoga's 280 Closings in 2025 Totaled $1.13 Billion, With a $20M Ranch Setting the Ceiling
Saratoga Q1 2026 Market Report
Saratoga Q1 2026: 22 Closings, $79.2M in Volume, and a $2,707/SF Outlier That Rewrote the Range