Saratoga's 280 Closings in 2025 Totaled $1.13 Billion, With a $20M Ranch Setting the Ceiling
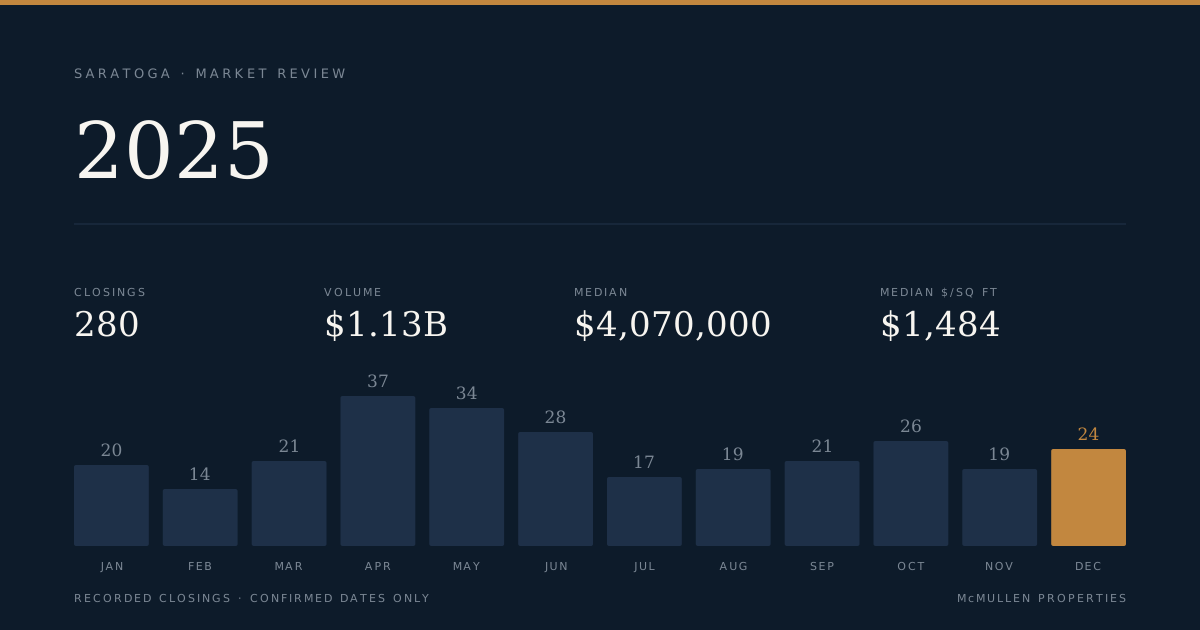
The period at a glance
| Metric | 2025 Full Year |
|---|---|
| Total closings | 280 |
| Total volume | $1,128,436,097 |
| Median sale price (all segments) | $4,070,000 |
| Median price per sq ft (all segments) | $1,484 |
| Median days on market | 10 |
| DOM reported on | 280 of 280 closings |
| Price range | $645,000 – $20,000,000 |
| Closings under 7 days | 101 (36%) |
| Closings over 60 days | 38 (14%) |
Days on market is recorded for all 280 closings, so the pace data carries its full weight. The median of 10 days is low, but the distribution underneath it tells a more layered story: 101 closings — more than a third of the year — recorded six days or fewer, while 38 closings took longer than two months. That is not a uniform market; it is two markets running in parallel. The 90 closings that settled between 8 and 21 days sit in the middle, and 51 more fell in the 22-to-60-day range. The longest recorded DOM was 289 days, belonging to the year's highest-priced transaction.
List prices are not available in the source data for this period, so no comparison against asking price is possible here or elsewhere in this report. What the record does show is $1.13 billion in closed volume across a city of roughly 30,000 people — an average of roughly $4.03 million per closing. The single-family segment, at 230 of the 280 closings, drove that figure. The median for the year across all segments settled at $4.07 million, with a median price per square foot of $1,484.
The sales
The table below shows the top 40 closings by sale price from the 280 recorded in 2025. It is not a complete roster.
| Address | Closed | Beds | Sq Ft | Sale Price | $/SF | DOM |
|---|---|---|---|---|---|---|
| 23600 Congress Springs Rd | 2025-08-01 | 3 | 3,200 | $20,000,000 | $6,250 | 268 |
| 15906 Cuvilly Way | 2025-11-08 | 5 | 6,493 | $11,888,000 | $1,831 | 10 |
| 15488 El Camino Grande | 2025-05-07 | 6 | 6,420 | $9,850,000 | $1,534 | 3 |
| 16233 Cuvilly Way | 2025-05-07 | 6 | 6,300 | $9,500,000 | $1,508 | 33 |
| 14966 Sobey Road | 2025-09-23 | 5 | 6,013 | $9,500,000 | $1,580 | 9 |
| 14008 Shady Oak Court | 2025-12-15 | 4 | 5,128 | $8,700,000 | $1,697 | 0 |
| 19825 Douglass Lane | 2025-12-02 | 4 | 5,480 | $8,600,000 | $1,569 | 12 |
| 20063 Spaich Court | 2025-12-09 | 5 | 4,511 | $7,850,000 | $1,740 | 22 |
| 20888 Ashley Way | 2025-06-05 | 5 | 5,196 | $7,800,000 | $1,501 | 6 |
| 19897 Park Drive | 2025-04-30 | 4 | 3,352 | $7,250,000 | $2,163 | 7 |
| 15181 Hume Drive | 2025-11-01 | 5 | 4,356 | $7,000,000 | $1,607 | 8 |
| 14941 Vickery Avenue | 2025-02-24 | 5 | 4,724 | $6,850,000 | $1,450 | 48 |
| 19305 Zinfandel Court | 2025-11-27 | 5 | 5,361 | $6,800,000 | $1,268 | 2 |
| 19573 Douglass Lane | 2025-03-19 | 4 | 4,655 | $6,800,000 | $1,461 | 9 |
| 18843 Montewood Court | 2025-05-27 | 6 | 6,498 | $6,715,000 | $1,033 | 6 |
| 14467 Sobey Road | 2025-08-27 | 4 | 5,080 | $6,507,000 | $1,281 | 59 |
| 20140 Rancho Bella Vista | 2025-04-18 | 5 | 4,422 | $6,500,000 | $1,470 | 2 |
| 14725 Live Oak Lane | 2025-06-30 | 5 | 4,959 | $6,450,000 | $1,301 | 72 |
| 14811 Vickery Avenue | 2025-06-25 | 6 | 3,952 | $6,450,000 | $1,632 | 11 |
| 19680 Versailles Way | 2025-10-08 | 4 | 3,848 | $6,365,000 | $1,654 | 8 |
| 20847 Russell Lane | 2025-05-29 | 5 | 3,523 | $6,300,000 | $1,788 | 9 |
| 13977 Albar Court | 2025-11-13 | 5 | 5,591 | $6,290,000 | $1,125 | 91 |
| 13165 Ten Oak Court | 2025-05-19 | 4 | 3,850 | $6,275,000 | $1,630 | 9 |
| 19405 Bainter Avenue | 2025-12-02 | 5 | 3,731 | $6,230,000 | $1,670 | 41 |
| 20535 El Dorado Court | 2025-03-07 | 5 | 4,000 | $6,180,000 | $1,545 | 6 |
| 13689 Sarahills Drive | 2025-04-11 | 4 | 3,260 | $6,180,000 | $1,896 | 8 |
| 12308 Crayside Lane | 2025-10-09 | 5 | 4,166 | $6,175,000 | $1,482 | 68 |
| 20802 Sevilla Lane | 2025-12-15 | 5 | 3,751 | $6,001,600 | $1,600 | 6 |
| 13998 Alta Vista | 2025-06-23 | 6 | 5,281 | $5,975,000 | $1,131 | 71 |
| 20115 Orchard Meadow Dr | 2025-06-21 | 7 | 7,491 | $5,900,000 | $788 | 47 |
| 14000 Shadow Oaks Way | 2025-07-18 | 5 | 3,333 | $5,900,000 | $1,770 | 0 |
| 19273 Citrus Lane | 2025-09-23 | 5 | 3,303 | $5,880,000 | $1,780 | 8 |
| 14429 Chester Avenue | 2025-06-05 | 5 | 4,190 | $5,850,000 | $1,396 | 23 |
| 20455 Franklin Avenue | 2025-09-03 | 4 | 3,176 | $5,700,000 | $1,795 | 5 |
| 19870 Mendelsohn Lane | 2025-04-10 | 4 | 3,770 | $5,630,000 | $1,493 | 51 |
| 12805 Pierce Road | 2025-06-23 | 6 | 4,040 | $5,600,000 | $1,386 | 25 |
| 13773 Prune Blossom Drive | 2025-03-20 | 5 | 3,631 | $5,600,000 | $1,542 | 8 |
| 14324 Cordwood Court | 2025-11-18 | 6 | 4,861 | $5,600,000 | $1,152 | 9 |
| 14740 Vickery Avenue | 2025-04-02 | 5 | 3,679 | $5,588,000 | $1,519 | 8 |
| 12979 Foothill Lane | 2025-05-07 | 5 | 5,111 | $5,550,000 | $1,086 | 82 |
Four transactions in this roster deserve attention beyond their price tags.
23600 Congress Springs Road is in a category of its own. At $20 million, it is the year's highest closing by nearly $8.1 million. It sits on 57.9 acres — 2,521,252 square feet of lot — and the 1923-vintage, 3-bedroom, 3,200-square-foot structure produces a price per square foot of $6,250, a figure that reflects land more than it reflects the building. It spent 268 days in the record before closing on August 1.
19897 Park Drive, a four-bedroom, 1938-vintage home of 3,352 square feet, closed at $7,250,000 in seven days — the fastest close among the top-ten by price. Its $2,163 per square foot is the highest in the roster among homes that are not the Congress Springs outlier, which warrants noting: smaller, older homes on certain lots produced higher per-foot figures than larger, newer construction at similar or higher prices.
15906 Cuvilly Way and 16233 Cuvilly Way — consecutive addresses on the same street — closed within six months of each other at $11,888,000 (10 DOM) and $9,500,000 (33 DOM) respectively. Both are five- and six-bedroom homes built between 2006 and 2008, ranging from 6,300 to 6,493 square feet. Their per-foot figures are close: $1,831 and $1,508.
13689 Sarahills Drive, built in 2023 and the newest construction in the top 40, closed at $6,180,000 on only 3,260 square feet — $1,896 per square foot, the second-highest per-foot figure in the roster after Congress Springs. New construction at smaller scale produced the steepest per-foot premium among conventionally structured homes.
Where the market split
By segment
| Segment | Closings | Median Price | Median $/SF | Median Sq Ft | Price Range |
|---|---|---|---|---|---|
| Single Family | 230 | $4,300,000 | $1,557 | 2,746 | $1.5M – $20M |
| Townhouse | 34 | $2,008,412 | $1,071 | 1,823 | $692K – $3.3M |
| Condominium | 16 | $1,065,000 | $869 | 1,265 | $645K – $2.03M |
Single-family homes account for 230 of 280 closings — 82% of all transactions. Their median of $4,300,000 at $1,557 per square foot rests on a sample large enough to be reliable. The 34 townhouse closings produced a median of $2,008,412 at $1,071 per square foot; the spread from $692,000 to $3,300,000 is wide for 34 sales, and the median should be read in that context. The 16 condominium closings have a median of $1,065,000; with a sample this size, the figure describes the year's transactions accurately but carries less statistical mass than the single-family median.
The per-foot gap between segments is consistent with their physical differences: condominiums at $869, townhouses at $1,071, and single-family at $1,557. The overall market median of $1,484 per square foot is pulled below the single-family figure by the presence of the lower-priced segments in the mix.
By price band
| Price Band | Closings | Median $/SF |
|---|---|---|
| Under $1M | 9 | $879 |
| $1M – $1.5M | 6 | $841 |
| $1.5M – $2M | 17 | $1,089 |
| $2M – $3M | 41 | $1,218 |
| $3M – $5M | 149 | $1,600 |
| $5M and up | 58 | $1,528 |
The most active band by a considerable margin is $3M–$5M, with 149 of the year's 280 closings — more than half the entire year's volume. Its median per-foot figure of $1,600 is also the highest of any band, higher than the $5M-and-up tier at $1,528.
That inversion — higher per-foot figures in the $3M–$5M band than in the $5M-and-up band — is one of the year's more observable patterns. The top tier includes several large-lot or large-footprint properties where the ratio of land to structure produces lower per-foot figures. Congress Springs Road is the extreme case at $6,250 per foot on a 57-acre lot, but several other $5M-plus closings in the roster also show per-foot figures below $1,200: 18843 Montewood Court ($1,033), 14725 Live Oak Lane ($1,301), 13977 Albar Court ($1,125), 13998 Alta Vista ($1,131), 20115 Orchard Meadow Drive ($788), and 14324 Cordwood Court ($1,152). Properties with large lot-to-structure ratios account for a meaningful share of the top tier and drag its median per-foot figure below the $3M–$5M band.
The $1M–$1.5M band, with only 6 closings, produces the lowest per-foot figure of any band at $841 — lower than the sub-$1M band at $879. With 6 sales, this figure describes those six transactions; it does not support broad conclusions about the band as a pricing tier.
Across the period
| Month | Closings | Median Price | Median $/SF |
|---|---|---|---|
| Jan 2025 | 20 | $4,025,000 | $1,696 |
| Feb 2025 | 14 | $3,319,000 | $1,529 |
| Mar 2025 | 21 | $3,650,000 | $1,461 |
| Apr 2025 | 37 | $3,763,000 | $1,513 |
| May 2025 | 34 | $4,369,000 | $1,454 |
| Jun 2025 | 28 | $4,752,000 | $1,409 |
| Jul 2025 | 17 | $3,650,000 | $1,600 |
| Aug 2025 | 19 | $4,060,000 | $1,440 |
| Sep 2025 | 21 | $4,100,000 | $1,505 |
| Oct 2025 | 26 | $3,595,000 | $1,468 |
| Nov 2025 | 19 | $4,400,000 | $1,481 |
| Dec 2025 | 24 | $3,605,000 | $1,558 |
The year's volume peaked in April (37 closings) and May (34 closings), consistent with spring contract activity translating into spring and early-summer closings. June recorded the highest monthly median price at $4,752,000 across 28 closings, pulled upward by a cluster of high-end single-family transactions. July dropped sharply to 17 closings and a $3,650,000 median — matching March's figure — before the fall months stabilized in the $3.6M–$4.4M range.
January's $1,696 per-foot figure is the highest monthly median per square foot of the year, recorded on 20 closings. It then declined across the spring, hitting its lowest point in June at $1,409 — the same month that recorded the highest median sale price. This is the per-foot inversion playing out over time: June's high-priced closings included several large-footprint or large-lot properties that carried lower per-foot figures, which pulled the per-foot median down even as total prices rose. July's jump to $1,600 per foot on only 17 closings reflects a mix shift toward smaller-footprint properties that month.
February was the quietest month at 14 closings. The second half of the year was more evenly distributed, ranging from 17 to 26 closings per month, with no month reaching April's pace. December finished with 24 closings and a $3,605,000 median — near the lower end of the year's range — and a per-foot figure of $1,558, above the annual median of $1,484.
What it means
For owners considering a sale: The transaction record shows 101 of 280 closings settling in six days or fewer, and another 90 between 8 and 21 days. That means 191 closings — 68% of the year — completed in three weeks or less. The $3M–$5M band, with 149 closings, is where the year's activity concentrated; properties in that range recorded the highest median per-foot figure of any price tier at $1,600. Properties with large footprints or large lots that closed above $5M recorded per-foot figures that in several cases fell below $1,200, reflecting the land-to-structure dynamic at the top of the range.
For those currently in the market: The data shows 38 closings — 14% of the year — that took longer than 60 days. The longest was 289 days. The year's record shows both a median of 10 days and a tail long enough to include nearly three dozen properties sitting well past the two-month mark. The $1M–$1.5M band recorded only 6 closings; inventory at that level was thin relative to the segments on either side. The condominium and townhouse segments together account for 50 closings — 18% of the year — with medians of $1,065,000 and $2,008,412 respectively.
For owners not transacting: Total closed volume of $1,128,436,097 across 280 transactions represents a full year's record in a city with a concentrated high-end market. The overall median settled at $4,070,000. The per-foot figures within the single-family segment at $1,557 across 230 sales, and the distribution of those sales — 82% of all closings — confirm the single-family market as the dominant factor in Saratoga's 2025 transaction record.
Tim McMullen · Tim McMullen, Broker · CA DRE #02016832
[email protected] · (415) 691-9272
More from Saratoga
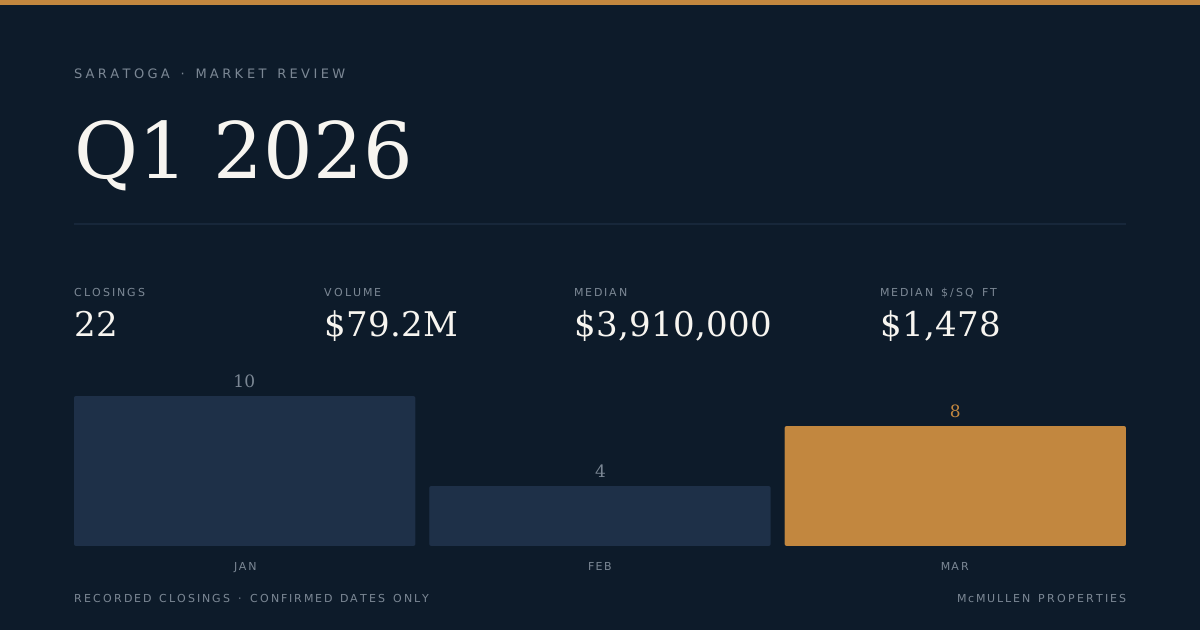
Saratoga Q1 2026: 22 Closings, $79.2M in Volume, and a $2,707/SF Outlier That Rewrote the Range
Twenty-two transactions closed across Saratoga in Q1 2026, spanning three segments and a price range from $960,000 to $5.55 million. The single-family segment carried the quarter, with a median of $4.2 million across 17 sales — while a 3-bedroom on Farwell Avenue posted the quarter's highest price-per-square-foot at $2,708.
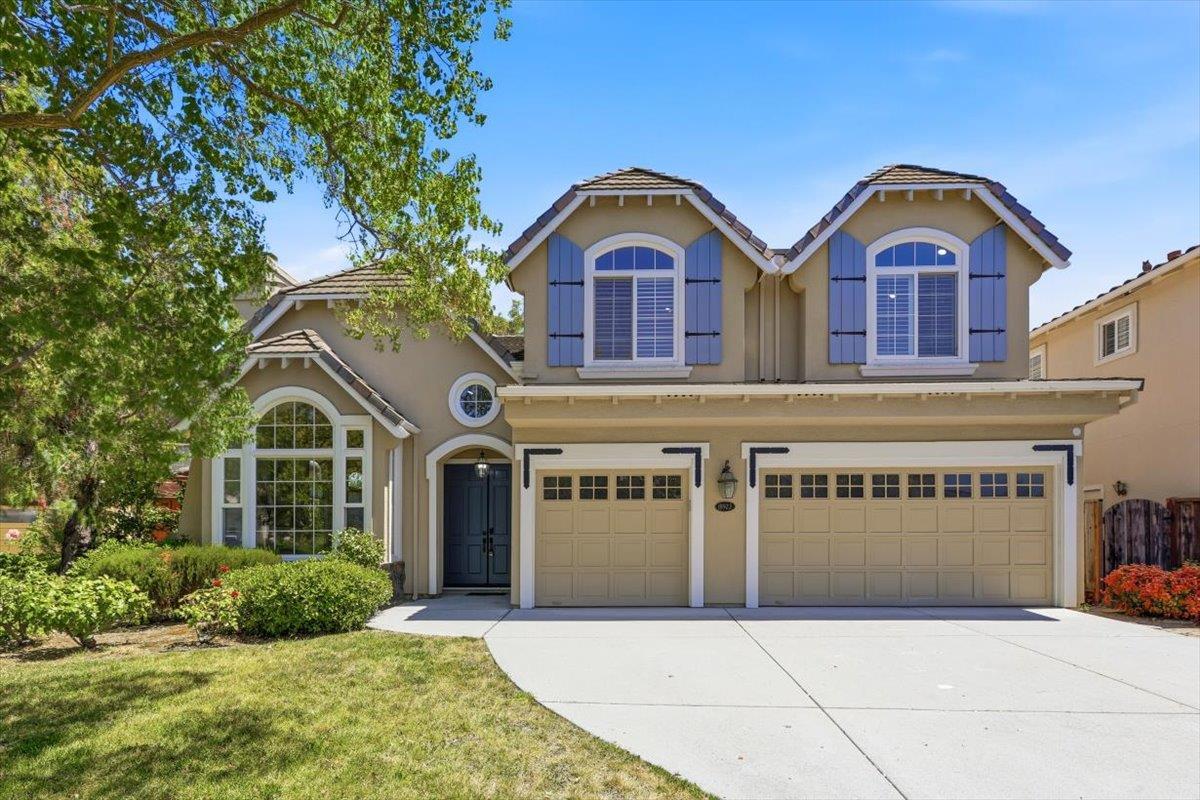
Back on the market 18 months after it last sold — at the exact same price
A Saratoga home recorded as sold in March 2025 for $4,700,000 is back on the market at $4,700,000. The owner is asking buyers to cover 17.7 months of carrying costs at no premium.
Saratoga's August median rebounds to $4.43M as the $3M–$5M band carries half the month's 20 closings
20 closings in Saratoga in August 2026, with the sample behind every number.