April 2026 in Saratoga: List price was the finish line — for exactly half the market
# April 2026 in Saratoga: List price was the finish line — for exactly half the market
Thirty-two closings. Seventeen over list, thirteen under, two right at it — and the median sale-to-list ratio landed at exactly 100%. That's not a rounding artifact. It's a genuinely split market where the overbids and the cuts balanced each other out to the dollar.
Every recorded sale this month
All 32 closings, in order of price. Each address links to its full record.
| Address | Type | Bd/Ba | Sq ft | List | Sold | % of list | DOM | Closed |
|---|---|---|---|---|---|---|---|---|
| 14920 Sobey Road | Single Family | 8/7 | 6,024 | $11,298,888 | $11,100,000 | 98.2% | 1 | Apr 3 |
| 19941 Sunset Drive | Single Family | 4/3 | 3,300 | $8,998,888 | $9,000,000 | 100.0% | 10 | Apr 29 |
| 20026 Heritage Oak | Single Family | 4/3.5 | 3,755 | $6,388,000 | $6,625,000 | 103.7% | 7 | Apr 13 |
| 14721 Live Oak Lane | Single Family | 7/5.5 | 6,132 | $6,298,000 | $6,300,000 | 100.0% | 23 | Apr 22 |
| 14582 Horseshoe Court | Single Family | 5/3.5 | 5,323 | $6,588,000 | $6,288,000 | 95.4% | 30 | Apr 28 |
| 13525 Surrey Lane | Single Family | 5/4 | 3,122 | $5,500,000 | $5,800,000 | 105.5% | 5 | Apr 1 |
| 13841 Malcom Avenue | Single Family | 5/3.5 | 3,636 | $5,350,000 | $5,625,000 | 105.1% | 2 | Apr 16 |
| 19104 Spring Brook Lane | Single Family | 4/3.5 | 4,725 | $5,980,000 | $5,616,800 | 93.9% | 19 | Apr 3 |
| 20483 Glen Brae Drive | Single Family | 5/3 | 3,117 | $4,688,000 | $5,600,000 | 119.5% | 6 | Apr 10 |
| 12312 Farr Ranch Road | Single Family | 4/3.5 | 3,483 | $5,360,000 | $5,360,000 | 100.0% | 0 | Apr 15 |
| 22301 Rolling Hills Road | Single Family | 2/2 | 2,010 | $4,995,000 | $4,900,000 | 98.1% | 6 | Apr 24 |
| 13755 Dolphin Drive | Single Family | 4/2 | 2,471 | $4,298,000 | $4,480,000 | 104.2% | 6 | Apr 2 |
| 19110 Dagmar Drive | Single Family | 5/4.5 | 3,070 | $4,650,000 | $4,250,000 | 91.4% | 49 | Apr 23 |
| 13367 Kahala Court | Single Family | 4/3 | 2,155 | $3,998,000 | $4,225,000 | 105.7% | 6 | Apr 9 |
| 12044 Saraglen Court | Single Family | 4/3 | 2,665 | $4,250,000 | $4,100,000 | 96.5% | 22 | Apr 8 |
| 12304 Saratoga Creek | Single Family | 4/2.5 | 2,631 | $3,798,000 | $3,960,000 | 104.3% | 5 | Apr 20 |
| 21700 Via Regina | Single Family | 4/3.5 | 3,392 | $3,988,000 | $3,839,400 | 96.3% | 42 | Apr 22 |
| 18660 Devon Avenue | Single Family | 5/3 | 2,029 | $3,088,000 | $3,570,000 | 115.6% | 8 | Apr 17 |
| 17881 Los Alamos Drive | Single Family | 4/3 | 2,349 | $3,288,888 | $3,500,000 | 106.4% | 11 | Apr 3 |
| 18940 Westview Drive | Single Family | 3/2.5 | 1,858 | $3,000,000 | $3,450,000 | 115.0% | 7 | Apr 2 |
| 19437 Via Real Drive | Single Family | 4/3 | 2,598 | $3,499,900 | $3,400,000 | 97.1% | 60 | Apr 10 |
| 13577 Myren Drive | Single Family | 3/2 | 1,550 | $3,250,000 | $3,375,000 | 103.8% | 13 | Apr 24 |
| 14175 Douglass Lane | Single Family | 2/1 | 971 | $2,999,888 | $3,285,000 | 109.5% | 8 | Apr 24 |
| 11891 Brookglen Drive | Single Family | 3/2.5 | 1,982 | $3,050,000 | $3,025,000 | 99.2% | 35 | Apr 16 |
| 17951 Los Felice Drive | Single Family | 3/1.5 | 1,220 | $1,998,000 | $2,430,000 | 121.6% | 6 | Apr 27 |
| 14637 Big Basin Way | Condominium | 3/3.5 | 2,141 | $2,168,000 | $2,100,000 | 96.9% | 33 | Apr 14 |
| 19816 Vineyard Lane | Condominium | 3/2 | 1,392 | $1,350,000 | $1,425,000 | 105.6% | 8 | Apr 8 |
| 19713 Vineyard Lane | Townhouse | 2/2.5 | 1,511 | $1,300,000 | $1,335,000 | 102.7% | 18 | Apr 9 |
| 19123 Vineyard Lane | Townhouse | 3/2.5 | 1,612 | $1,300,000 | $1,265,000 | 97.3% | 6 | Apr 24 |
| 18932 Sara Park Circle | Townhouse | 2/2 | 1,086 | $910,000 | $910,000 | 100.0% | 15 | Apr 24 |
| 14351 Saratoga Avenue #A | Condominium | 2/2 | 1,252 | $945,000 | $900,000 | 95.2% | 68 | Apr 14 |
| 20812 4Th Street #6 | Condominium | 2/2 | 1,158 | $899,000 | $860,000 | 95.7% | 50 | Apr 7 |
The numbers
| Metric | April 2026 |
|---|---|
| Closings | 32 |
| Median sale price | $3,899,700 |
| Median price per sq ft | $1,532 |
| Median days on market | 9 |
| Sale-to-list ratio (median) | 100% |
| Sold over list | 17 |
| Sold under list | 13 |
What sold
Single family homes carried the month. Twenty-five sales, ranging from $2,430,000 to $11,100,000. The median among them sat at $4,250,000, with a median of 8 days on market and $1,759 per square foot. That's the segment where the real spread lives — nearly a $9 million gap between the low and the high.
Condominiums had four sales, from $860,000 to $2,100,000. Too few to report a median responsibly, so the range is what the data supports.
Townhouses recorded three sales, from $910,000 to $1,335,000. Same situation — range only.
The attached and multi-family segments together made up just 22% of closings, which is worth knowing when you're reading the citywide median.
What moved the median
Single-family homes were 78% of April's volume. The mix didn't shift enough to distort the headline numbers — the median of $3,899,700 and the $1,532 per square foot reflect what the market actually paid, not a compositional trick. There's no asterisk needed here.
What's worth sitting with is the 100% sale-to-list ratio alongside nine days as the median time to contract. That combination tells you homes priced correctly moved fast and at price. The ones that didn't — Dagmar Drive being the clearest example — had to give something back.
The one to notice
17951 Los Felice Drive listed at $1,998,000 and closed at $2,430,000. That's $432,000 over ask — 21.6%. In a month where the median home sold at exactly list price, that number stands out. It didn't take long either; this is the kind of result that happens when a well-priced home in a specific pocket of the market finds more than one motivated buyer at the same moment. The $1,998,000 list was presumably deliberate — priced to draw a crowd. It worked. Whether the list was a starting gun or a genuine valuation, the market answered at $2.43 million.
For context: the citywide median this month was $3,899,700. Los Felice came in well below that and still generated the month's biggest overbid percentage. That's a reminder that overbid stories aren't exclusive to the trophy end of the market. Sometimes they happen on a Tuesday in the low twos.
The top sale, 14920 Sobey Road at $11,100,000 for 6,024 square feet, closed in one day and set the month's ceiling. The deepest cut, 19110 Dagmar Drive at $4,250,000 against a $4,650,000 list, was also the single-family median — a coincidence worth noting, not reading into.
Thirty-two closings. A market that split almost evenly between buyers who paid over list and sellers who accepted less. Nine days to get there. That's April.
Source: MLSListings closed sales in Saratoga, April 2026. 32 closings. Sale prices and closing dates are matters of public record. A summary of recorded sales is not an appraisal and is not an opinion of value on any specific home.
Tim McMullen · DRE #02016832 · How these numbers are put together
More from Saratoga
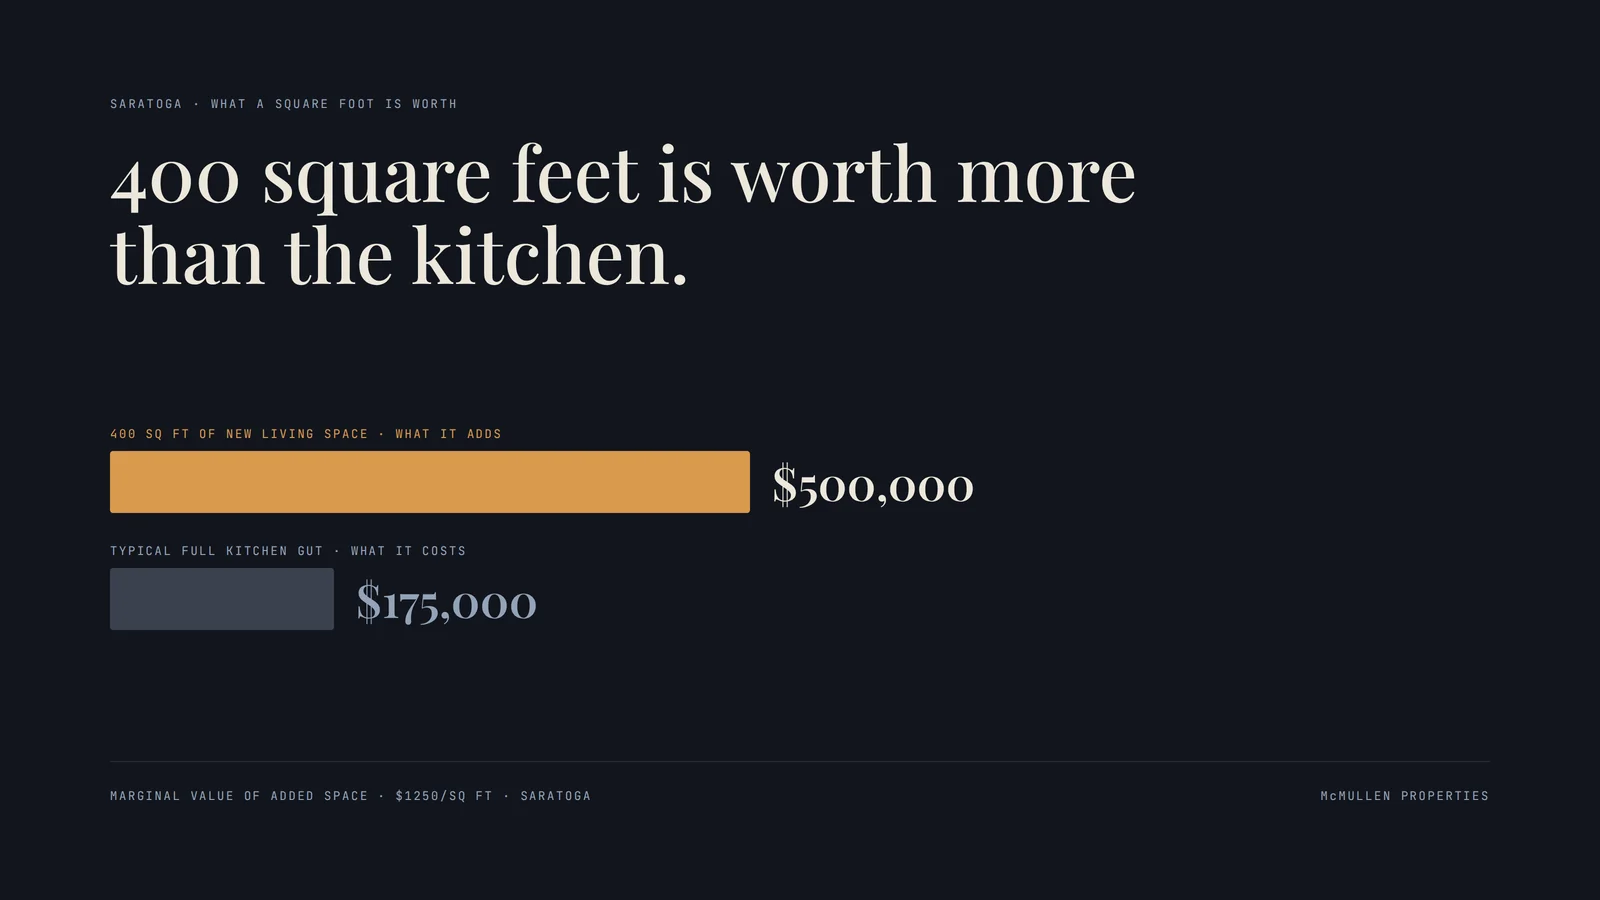
The renovation everyone does returns the least. Here is what actually moves the number.
Four ways to add value to a Saratoga home, ranked by what they actually return — and why the full kitchen gut is near the bottom.
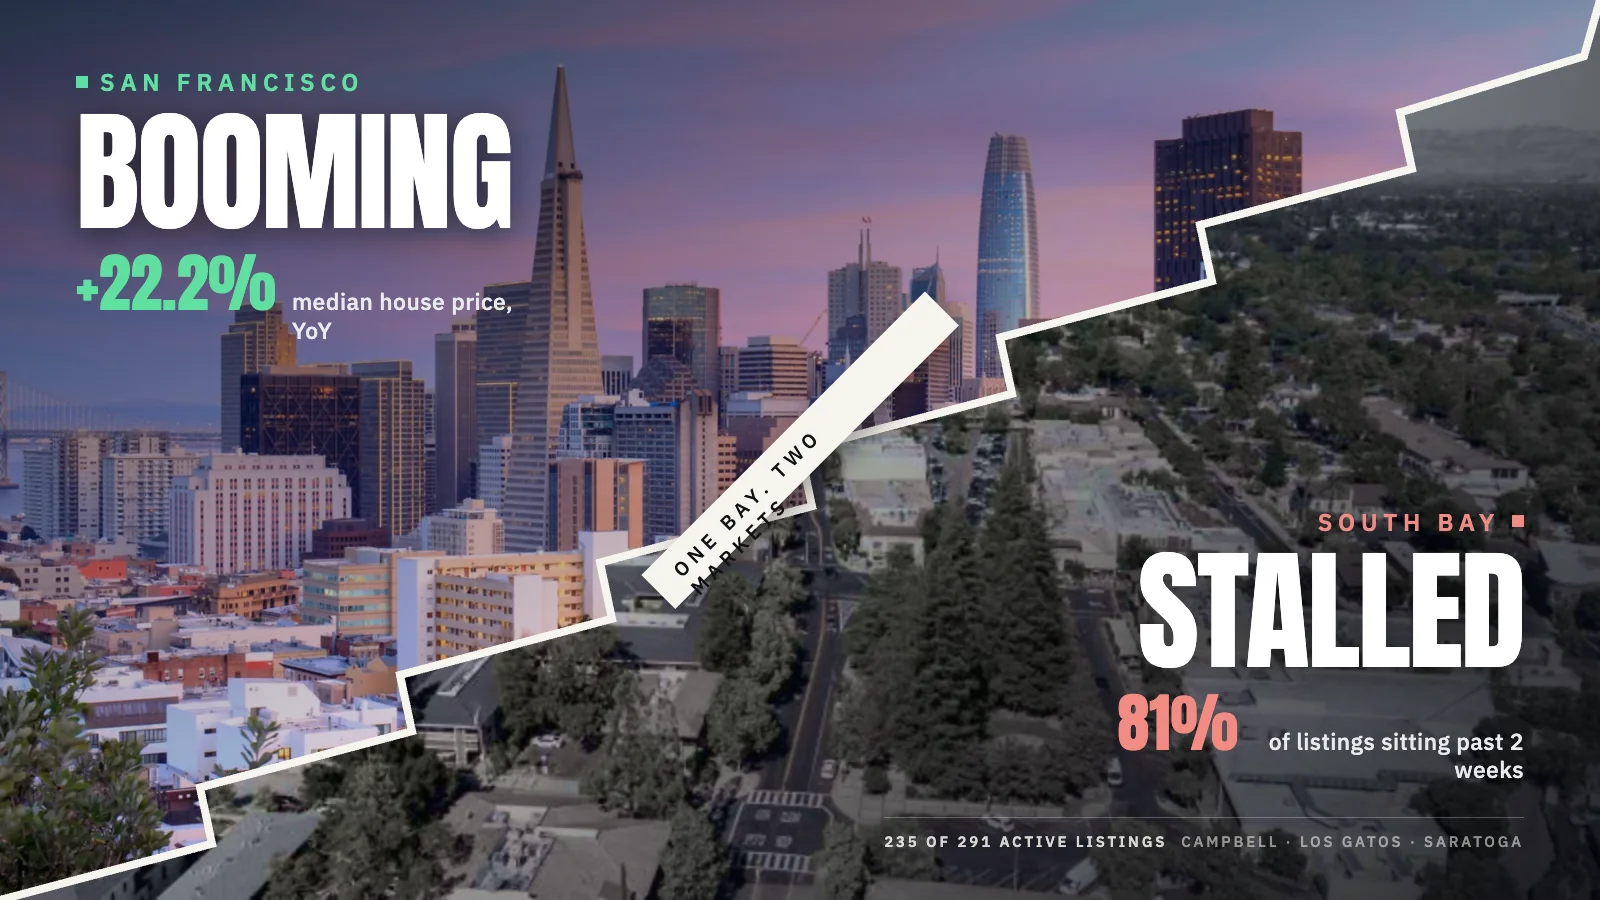
The cheap house is the one nobody wants. That is the whole story of this market.
San Francisco single-family homes are up 22.2% year over year to $2.2 million on AI money. In Saratoga, 75% of active listings have been sitting more than two weeks — and the slow ones are the cheap ones.
A marketplace that sells rental homes without dragging the tenant through it
No showings, no sign, no open houses. The Investor Exchange lists tenant-occupied property directly to investors — and the tenancy transfers untouched.