March 2026 in Saratoga: Twenty of Twenty-Eight Sales Closed Above Ask
# March 2026 in Saratoga: Twenty of Twenty-Eight Sales Closed Above Ask
Eight days. That's the median time a Saratoga home spent on market in March. Twenty of the twenty-eight recorded closings settled above list price, seven came in below, and the median sale-to-list ratio landed at 105.1%. This was a month where the list price, in most cases, was a starting point.
The Numbers
| Metric | March 2026 |
|---|---|
| Total closings | 28 |
| Median sale price | $4,052,500 |
| Median price per sq ft | $1,579 |
| Median days on market | 8 |
| Sale-to-list ratio (median) | 105.1% |
| Closed above list | 20 |
| Closed below list | 7 |
What Sold
Single Family (24 sales)
The single-family segment dominated March — 24 of the 28 closings, spanning $1,691,000 at the low end to $8,700,000 at the top. The median sale price for this segment was $4,147,500, with a median of $1,629 per square foot and a median of eight days on market.
Townhouse (4 sales)
Four townhouse closings is too small a sample for a reliable median, so: the four recorded sales ranged from $1,980,521 to $2,728,000. That range is the picture — no single figure summarizes it well.
What Moved the Median
The segment mix in March — 86% single-family — did not shift materially enough to explain the median on its own. The $4,052,500 citywide median reflects the prices these homes actually closed at, not a composition effect. Twenty closings above list, a median sale-to-list of 105.1%, a median of eight days — those are the conditions under which this month's prices were recorded.
The One to Notice
14000 Jerries Drive listed at $3,298,000 and closed at $4,120,000 — $822,000 over asking, a gap of 24.9%. That was the widest overbid of the month, and it's worth sitting with for a moment: the seller priced the home at $3.3 million, and the recorded sale price came in nearly a quarter higher. Whatever the list price was meant to signal, the market answered differently. One sale, one number — but it's the number that stands out most in March's ledger.
Worth noting in the same breath: 19315 San Marcos Road, a 4,840-square-foot home, closed at $8,700,000 after 44 days on market — the month's top sale by a wide margin, and the longest sit among the notable transactions. At the other end, 10330 Elm Circle #12-03 Plan 2 listed at $2,117,981 and closed at $1,999,531, a 5.6% reduction — the deepest cut of the month, and a reminder that not every listing in March found its price above ask.
Every recorded sale this month
All 28 closings, in order of price. Each address links to its full record.
| Address | Type | Bd/Ba | Sq ft | List | Sold | % of list | DOM | Closed |
|---|---|---|---|---|---|---|---|---|
| 19315 San Marcos Road | Single Family | 5/5.5 | 4,840 | $8,888,000 | $8,700,000 | 97.9% | 44 | Mar 27 |
| 12359 Farr Ranch Road | Single Family | 4/4 | 6,529 | $7,498,000 | $7,340,000 | 97.9% | 206 | Mar 20 |
| 13999 Alta Vista Avenue | Single Family | 6/5.5 | 4,798 | $5,998,000 | $6,750,000 | 112.5% | 4 | Mar 27 |
| 19401 San Marcos Road | Single Family | 5/5 | 3,571 | $5,200,000 | $5,500,000 | 105.8% | 4 | Mar 2 |
| 12791 Ione Court | Single Family | 5/4.5 | 3,357 | $5,180,000 | $5,428,800 | 104.8% | 8 | Mar 4 |
| 14041 Jerries Drive | Single Family | 4/2.5 | 3,050 | $4,998,000 | $5,415,000 | 108.3% | 10 | Mar 27 |
| 13243 Via Ranchero Drive | Single Family | 6/4 | 3,124 | $4,888,000 | $5,125,000 | 104.8% | 3 | Mar 5 |
| 12343 Ted Court | Single Family | 4/3.5 | 3,069 | $3,998,000 | $4,905,000 | 122.7% | 11 | Mar 25 |
| 19319 Falmouth Court | Single Family | 5/3 | 2,527 | $3,988,950 | $4,800,000 | 120.3% | 8 | Mar 16 |
| 13240 Via Grande Court | Single Family | 4/2.5 | 2,475 | $3,998,000 | $4,687,000 | 117.2% | 6 | Mar 2 |
| 20885 Wardell Road | Single Family | 5/4 | 3,606 | $3,998,000 | $4,212,000 | 105.4% | 5 | Mar 24 |
| 20460 Williams Avenue | Single Family | 5/3.5 | 3,471 | $3,998,000 | $4,175,000 | 104.4% | 177 | Mar 5 |
| 14000 Jerries Drive | Single Family | 3/2.5 | 1,974 | $3,298,000 | $4,120,000 | 124.9% | 9 | Mar 2 |
| 12135 Country Squire Way | Single Family | 4/2 | 1,672 | $3,588,888 | $4,100,000 | 114.2% | 6 | Mar 11 |
| 15684 Apollo Heights Court | Single Family | 5/3 | 3,139 | $3,500,000 | $4,005,000 | 114.4% | 5 | Mar 10 |
| 19095 Saratoga Glen Place | Single Family | 4/2.5 | 2,534 | $3,750,000 | $3,950,000 | 105.3% | 6 | Mar 30 |
| 19938 Baroni Court | Single Family | 4/3 | 2,071 | $3,680,000 | $3,700,000 | 100.5% | 1 | Mar 9 |
| 19061 Brookhaven Drive | Single Family | 4/2 | 2,141 | $3,650,000 | $3,600,000 | 98.6% | 23 | Mar 19 |
| 18855 Aspesi Drive | Single Family | 3/2.5 | 1,804 | $2,998,000 | $3,020,000 | 100.7% | 5 | Mar 16 |
| 18255 Mccoy Avenue | Single Family | 4/3 | 1,891 | $2,950,000 | $2,930,000 | 99.3% | 57 | Mar 25 |
| 18597 Paseo Pueblo | Single Family | 3/1.5 | 1,260 | $2,450,000 | $2,780,000 | 113.5% | 12 | Mar 12 |
| 14681 Springer Avenue | Townhouse | 4/2.5 | 2,585 | $2,848,000 | $2,728,000 | 95.8% | 12 | Mar 5 |
| 20808 Pamela Way | Single Family | 3/2 | 1,568 | $2,588,888 | $2,700,000 | 104.3% | 15 | Mar 16 |
| 18060 King Court | Single Family | 3/2.5 | 1,500 | $1,999,888 | $2,190,000 | 109.5% | 8 | Mar 10 |
| 14648 Placida Court | Townhouse | 3/2.5 | 2,163 | $1,798,000 | $2,025,000 | 112.6% | 9 | Mar 2 |
| 10330 Elm Circle #12-03 Plan 2 | Townhouse | 3/3 | 1,741 | $2,117,981 | $1,999,531 | 94.4% | 41 | Mar 28 |
| 10730 Elm Circle #86-17 Plan 2 | Townhouse | 3/3 | 1,741 | $2,075,821 | $1,980,521 | 95.4% | 22 | Mar 20 |
| 20750 Wildwood Way | Single Family | 3/2 | 1,405 | $1,691,000 | $1,691,000 | 100.0% | 0 | Mar 30 |
Data reflects recorded MLS closings for the period March 1–31, 2026.
Source: MLSListings closed sales in Saratoga, March 2026. 28 closings. Sale prices and closing dates are matters of public record. A summary of recorded sales is not an appraisal and is not an opinion of value on any specific home.
Tim McMullen · DRE #02016832 · How these numbers are put together
More from Saratoga
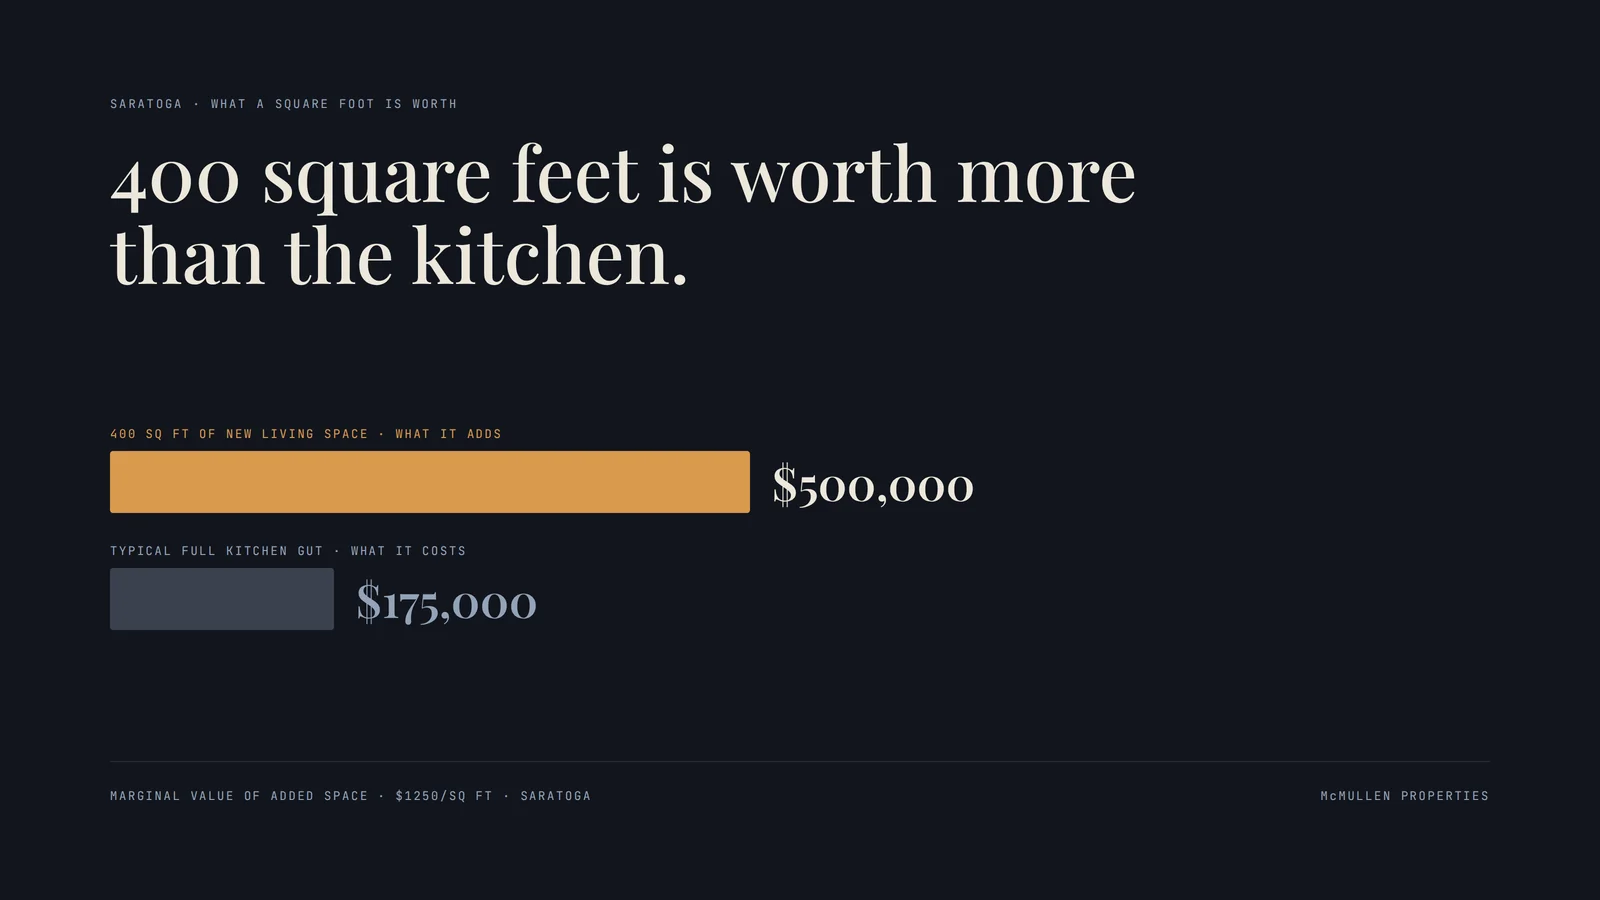
The renovation everyone does returns the least. Here is what actually moves the number.
Four ways to add value to a Saratoga home, ranked by what they actually return — and why the full kitchen gut is near the bottom.
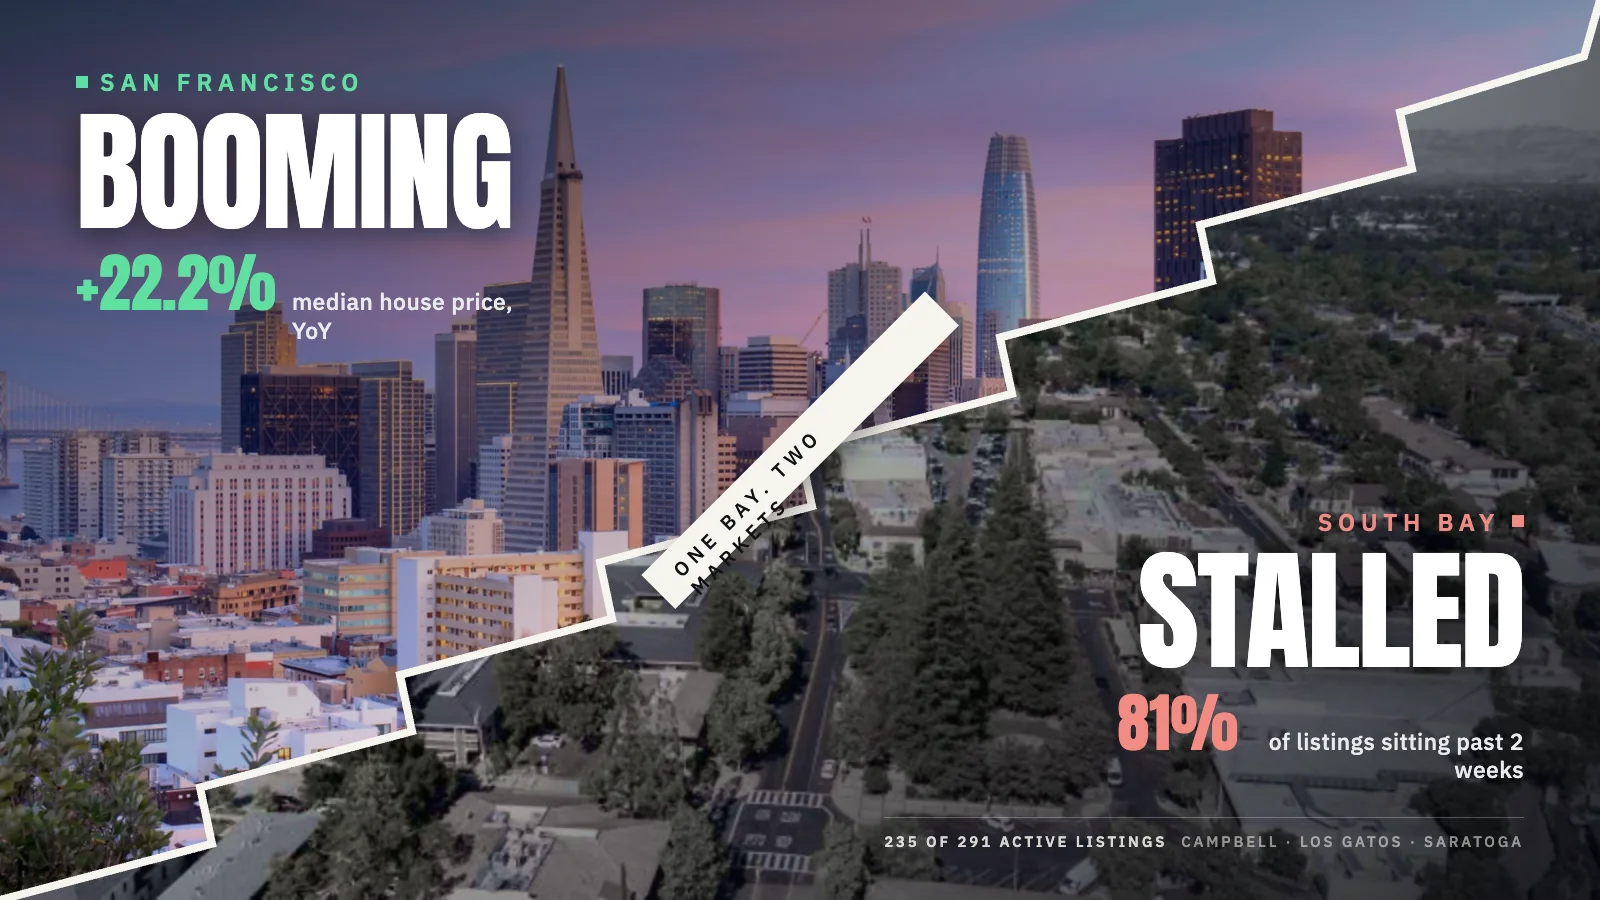
The cheap house is the one nobody wants. That is the whole story of this market.
San Francisco single-family homes are up 22.2% year over year to $2.2 million on AI money. In Saratoga, 75% of active listings have been sitting more than two weeks — and the slow ones are the cheap ones.
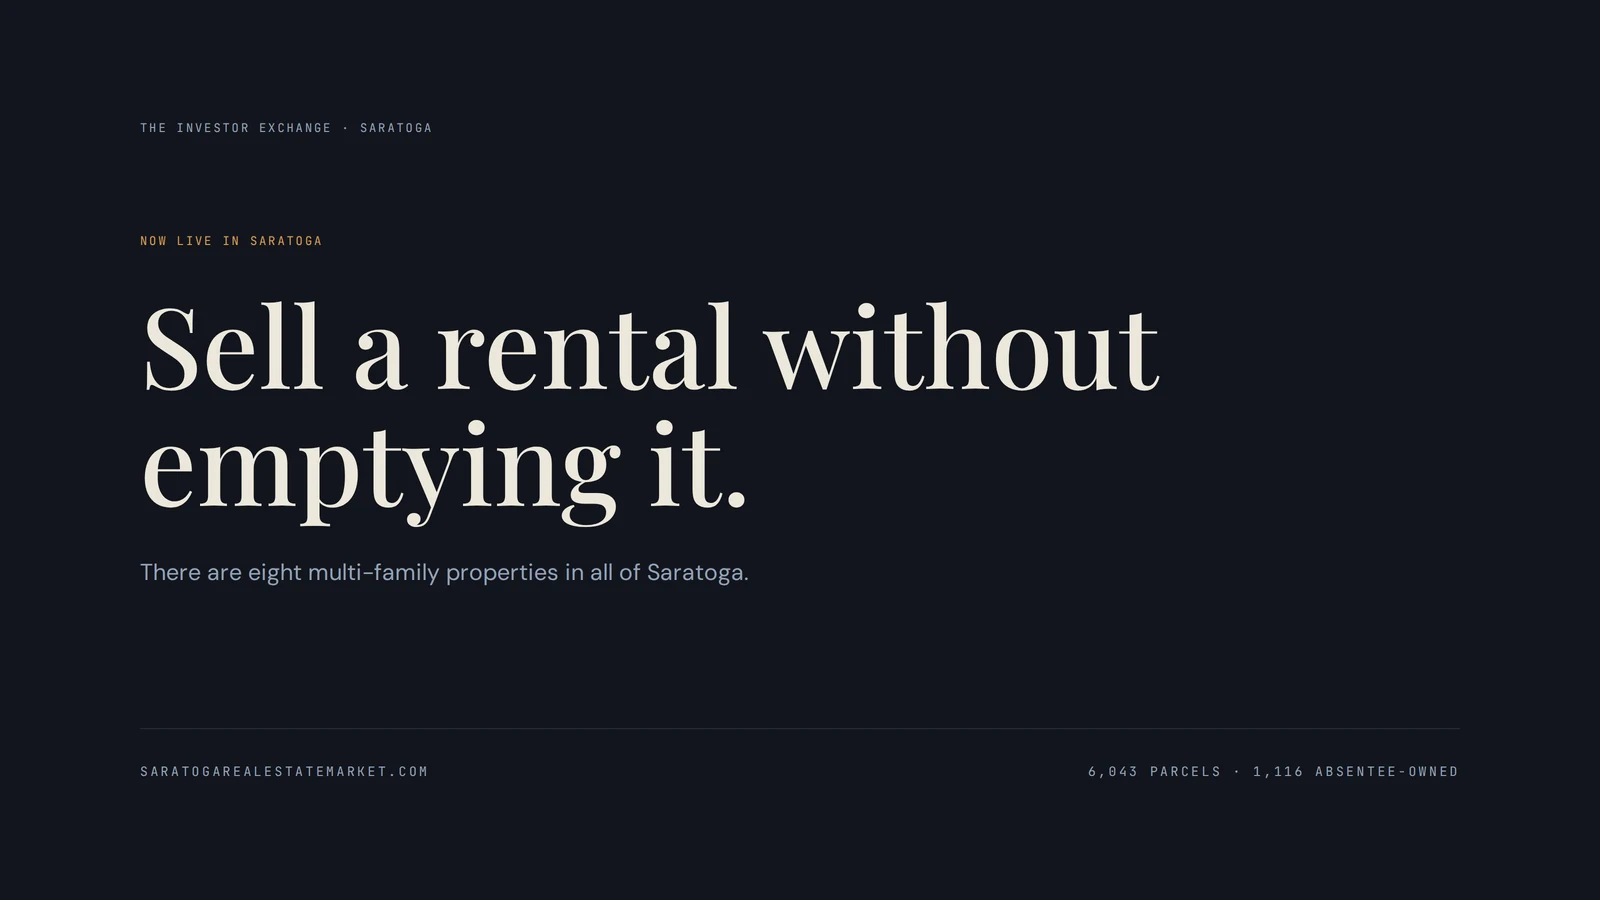
A marketplace that sells rental homes without dragging the tenant through it
No showings, no sign, no open houses. The Investor Exchange lists tenant-occupied property directly to investors — and the tenancy transfers untouched.